Statistics
Understand what sells over the period you choose
Understand your sales by product, country, payment method and promotion over the period you choose.
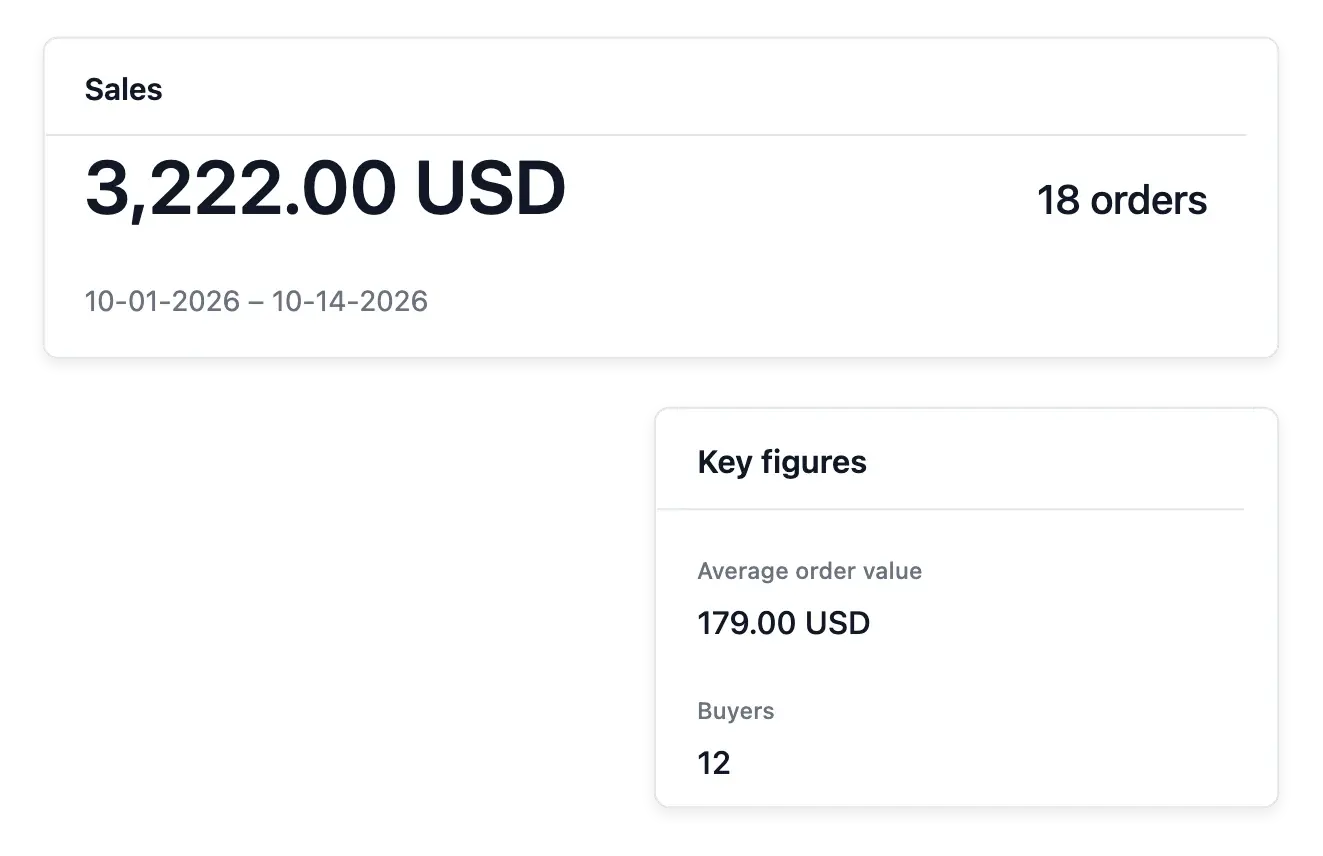
Understand what your shop sells
- Sales over time
Compare orders, average order value, buyers and refunds over your chosen dates.
- Know what sells
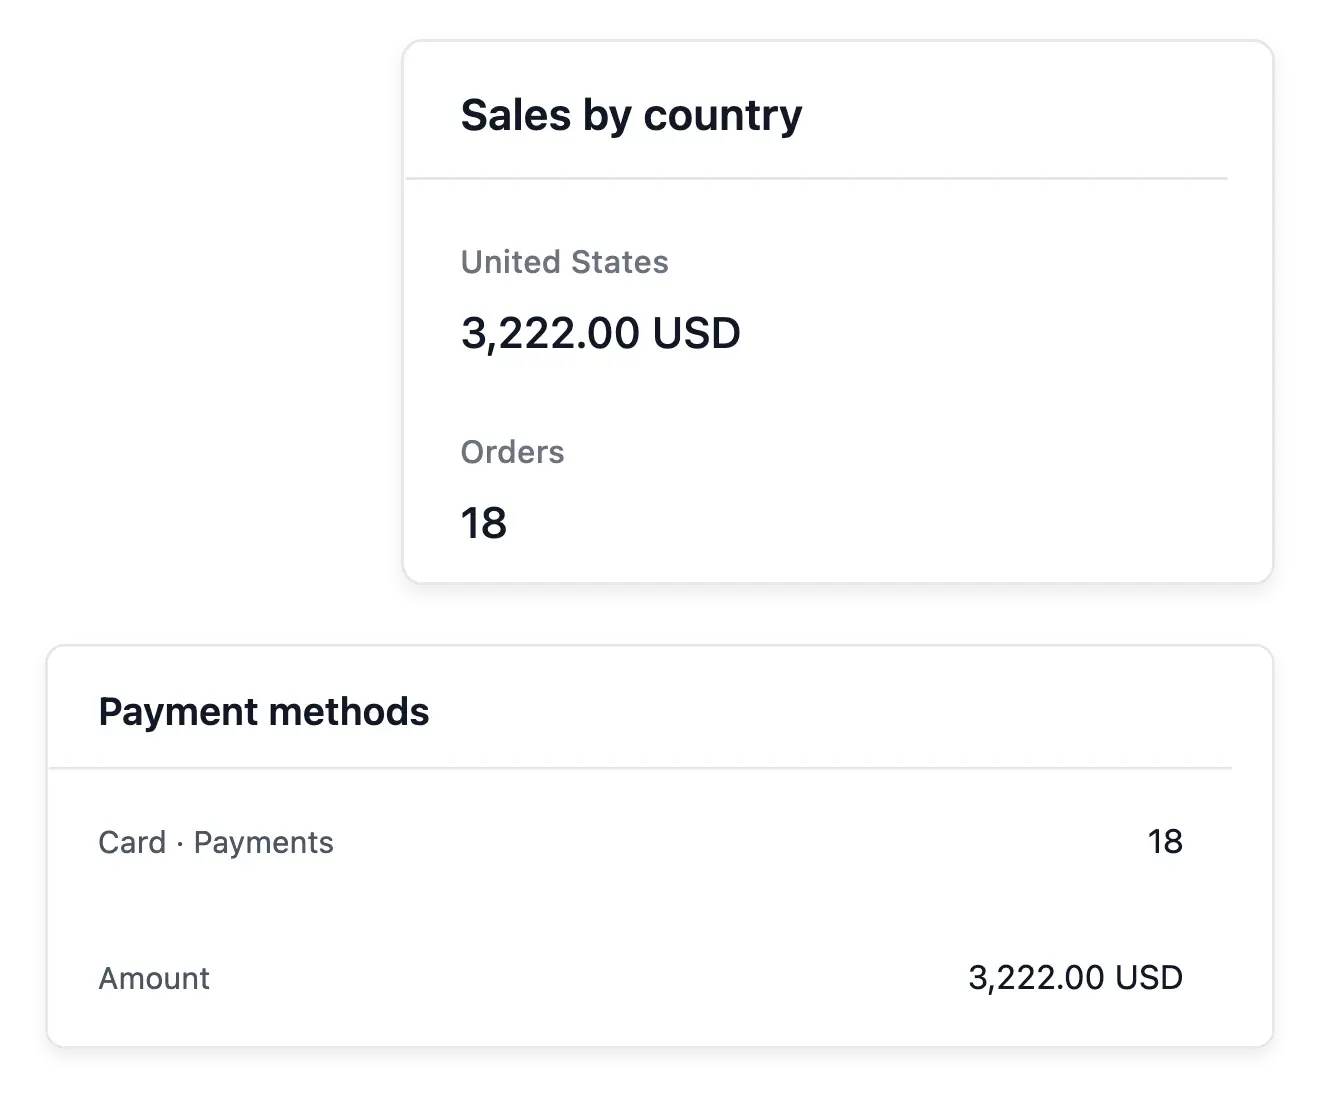
Read product rankings and sales by country and condition grade.
- Understand each sale
Break results down by payment method, order status and discount code.
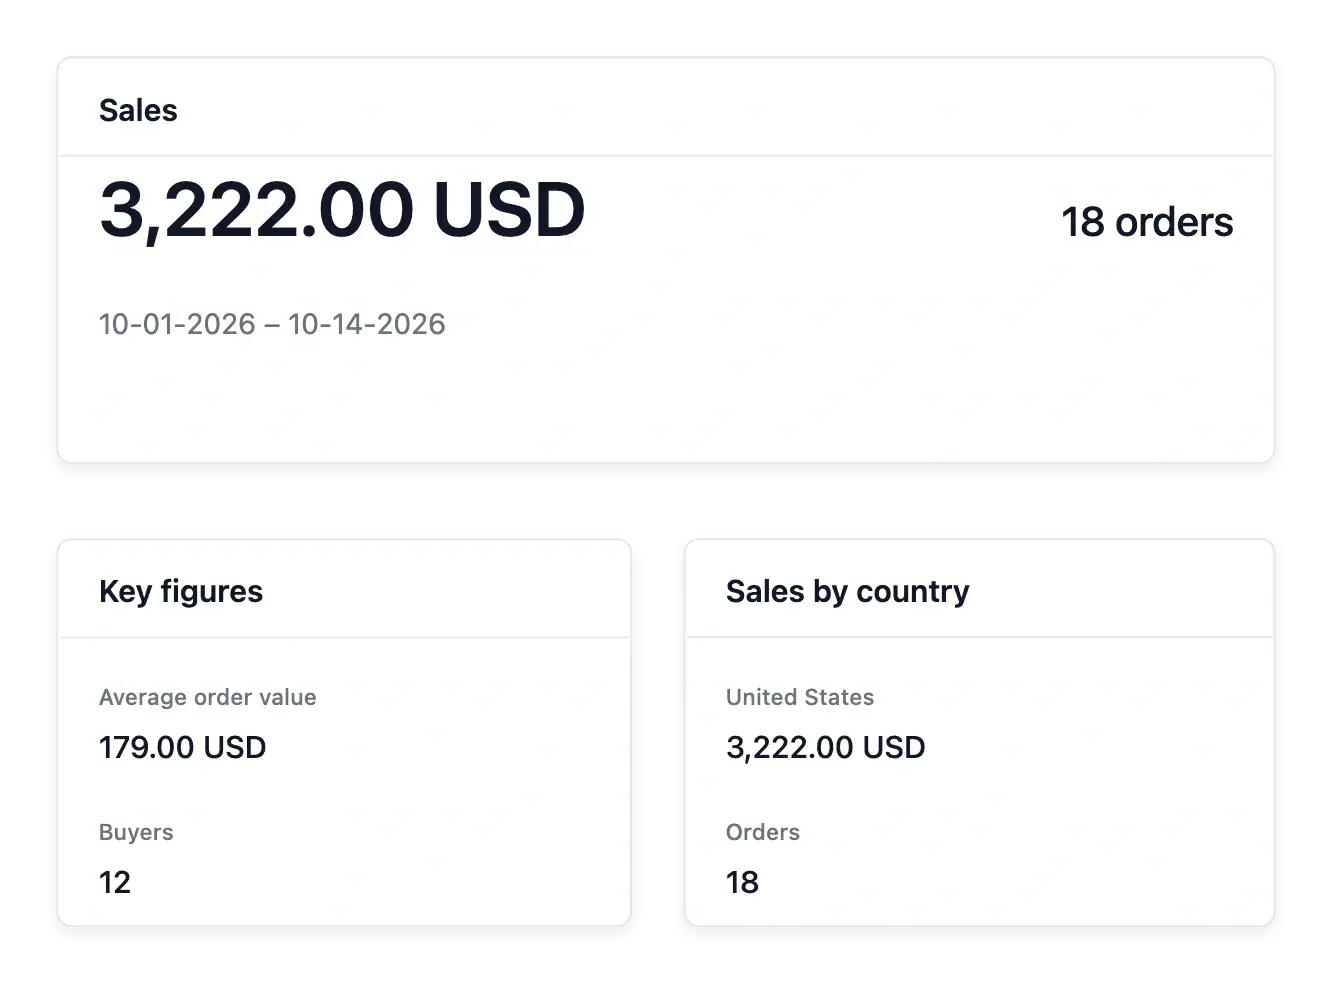
Give sales figures a shared period
Choose the dates for your report and read orders, average order value, buyers and refunds over that same range. Daily sales make the trend visible before you move into the detailed tables.
Product, country and condition breakdowns help you see what contributes to the recorded results. Compare the mix behind a total: a change in volume can have a different meaning from a change in the value of each order.
Compare sales with the right measurement context
A consistent date range. Choose the dates before reading the recorded sales measures. Compare periods using the same question and measurement scope.
Product-level detail. Open the supported product breakdown to inspect how references contribute. A shop-wide total can hide different results across the range.
Sales and browsing separately. Use Audience for page and product attention. Interest in an item and a recorded sale are different observations.
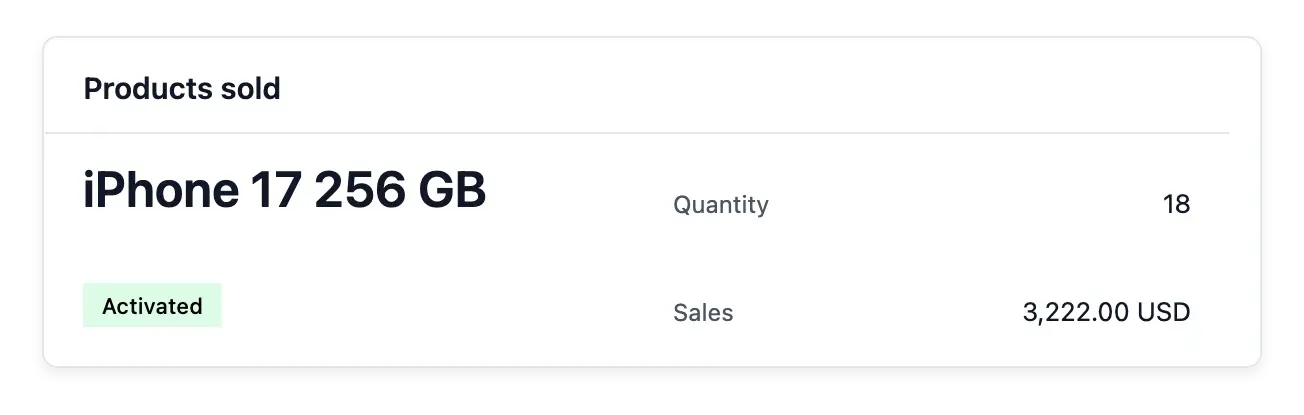
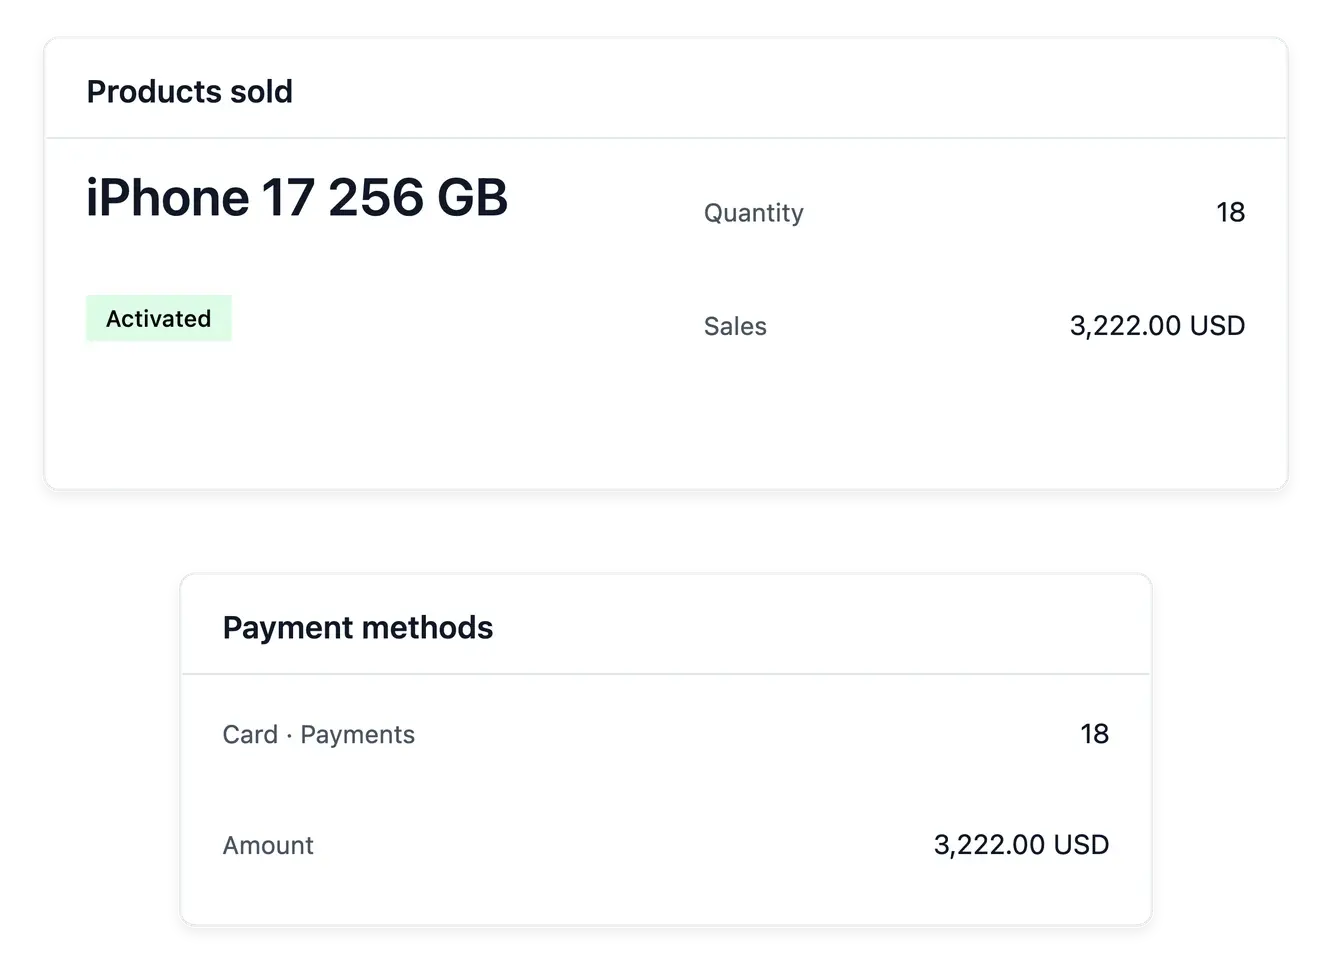
Investigate the composition of your sales
Payment methods, order states and discount codes provide further views of the selected period. Open the complete breakdown when a summary raises a question, rather than extrapolating from a few preview rows.
This is the sales perspective of the shop. Use Audience to study visits and Live to follow current events; these reports serve different questions and should not be treated as interchangeable totals.
Turn a period result into a focused review
Set the comparison. Choose the relevant period and read its totals first. Keep the dates with the conclusion you draw from the view.
Inspect the range. Review the product breakdown and open the relevant product when needed. Check availability and presentation before assuming why a reference changed.
Return to actual records. Use orders and payments for a particular transaction. Statistics summarizes recorded activity without proving every marketing or operational cause.
Build your next move on understood sales
Explore the products, markets and methods behind the figures your shop records.
Questions about Statistics
Yes. A shared date range drives the figures, chart and detailed sales views.
Yes. The product breakdown provides the sales ranking for the chosen period.
Yes. Both have dedicated breakdowns alongside the product view.
Yes. The discount view shows the codes recorded on orders in the period.
Its focus is sales. Audience provides the visit and page-view perspective.
They are operational shop reports, rather than a replacement for your accounting records and reconciliation.